Dr Scott Lynn gives a practical explanation of how variable effective golf swings can be while looking at Matt Kuchar’s pressure data.
Last year, February of 2016 when the tour came to LA, Dr Scott Lynn had the opportunity to measure Matt Kuchar’s swing on the Swing Catalyst right before the tournament.
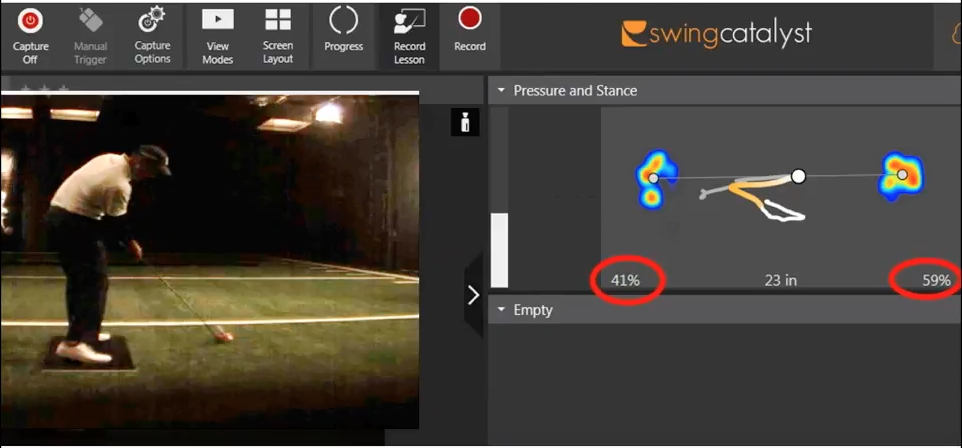
After hitting some shots Matt came back to look at his swing and saw he has 41% of his pressure on his lead foot, and 59% percent of his pressure on the trail foot at impact.
Dr Lynn had never seen anything that looked like that before.
Matt Kuchar asked, “Hey, what do you think, man, what does it look like?” And Dr Lynn replied with, “Honestly Matt, I have never seen anything that looks like this before.”
They had a launch monitor running at the same time and Kuchar liked what he saw. The club head speed was pretty good. and since he likes to hit fades his path was moving a little left with a face that was slightly open to the path.
“Honestly Matt, I have no idea. I’ve never seen anything like this. I wouldn’t mess with it.” Dr Scott Lynn replied.
Matt went out that week and finished somewhere in the top 10 while gaining a shot on the field in total driving that week.
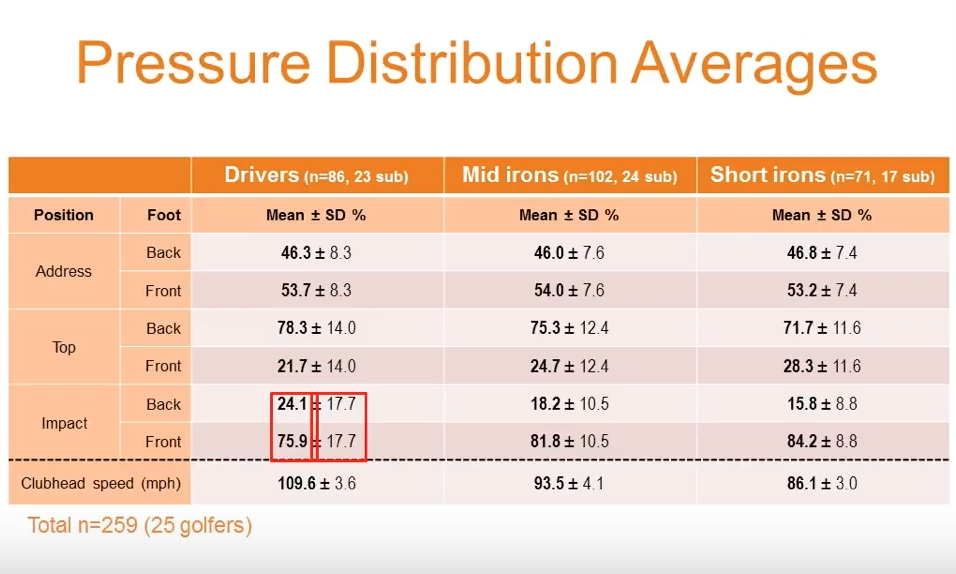
What this chart tells us is that with the driver at impact, the average PGA Tour player has 75.95% of their pressure on their front foot, and 24% on their back foot.
At impact, you want to have more pressure forward than backwards. You might hear some recommend 80/20 and this is telling us with a driver, it’s 75.9%, and 24.1% on average.
When looking at a chart like this (averages) it’s critical to know the standard deviations of those averages. As golfers and educated consumers whenever you see averages it’s very important to get standard deviations to help interpret those numbers.
When looking at this chart with standard deviations we can see there is quite a bit of difference that’s happening!
There’s some guys on tour who have 99% of their pressure, almost 100% of their pressure on their lead foot at impact, and there are guys that’ll have less than 50% of their pressure on their lead foot at impact.
Both are both making their living playing this game at the highest level, so obviously there’s something that’s working about doing that.
If we take a chart like this, and try to get every single golfer to get near the average how many golfers will you actually help?
We need to really start figuring it out what the differences are that allows someone to be successful with 99% of pressure on front and another with 47% pressure on their front foot.
“If we try to get everyone to the average, I think we’re gonna mess up more people than we help.
What I’ve been finding in the golf swing is that there’s so many different ways to make this happen, we need a system to try to account for all this. But the average Joe like you and I better be swinging the way our body’s designed, or else it’s not gonna be pretty out there.”
– Dr Scott Lynn
Want to learn more from Dr Scott Lynn and other LEADERS in the field?
Check out our Golf Swing Summit and gain insights into what the best are teaching and why.