The Biirdie Golf team recently completed its first tournament level mental game analytics experiment at a junior golf tournament and told the story of what they learned and how it might help you.
Biirdie Golf is a mental game self assessment tool that golfers complete following their outings. This “Round Review” data syncs with our platform and helps golfers see the relationships in their game that result from their process, emotions, and health/nutrition.
Using Biirdie is definitely a new experience. The junior golfers who completed the round reviews were laughing at some of the questions, likely out of surprise and discomfort, because they’ve never evaluated their golf game on these metrics (like “did you pick a clear target and vividly see the ball at rest at your target?”, or “were you able to use your emotions to refocus or did your emotions distract you?”.
If you’d like to try it out yourself visit the website biirdiegolf.com and use the coupon code golfsciencelab and get ONE MONTH FREE.
Take aways from the data
On Scoring:
Average scores for the first three holes was HIGHER than the average score for the last three holes. This is interesting and could be explained by a couple factors, which potentially include temperature, changing wind conditions, nervousness, etc.
What we found interesting, is that scoring for the last three holes was lower, when you might expect them to be higher. We’re talking about a tournament here – with the closing holes often being the deciding factors on who wins the tournament.
On Process:
Players believed they were strongest in the process metrics of: “finding rhythm during warmup on full shots”, and “locking on target / keeping eyes focused”. The lowest players ratings were against the metrics of “posture” and “visualizing your shots”.
On Emotions:
On every round review question about emotions, at least one player rated themselves as “very intense”, whereas a player only rated themselves as “very calm” once across every rating across all players.
On Health/Nutrition:
Water consumption varied greatly with a low of 1 bottle and a high of 5 bottles consumed. Players slept an average of 7.5 hours.
Correlations:
We performed a statistical analysis using the Pearson correlation coefficient to figure out which input metrics (hours of sleep, visualization techniques) are most closely linked to scoring outcomes (score to par).
Although the statistical relationships are classified as weak-negative (e.g. as you drink more water, not much happens to your score dropping) for decision making, visualization, feeling your shots, locking on target, choosing risk appropriate shots, and posture, the data shows that these inputs into our golf process do relate to how we score.
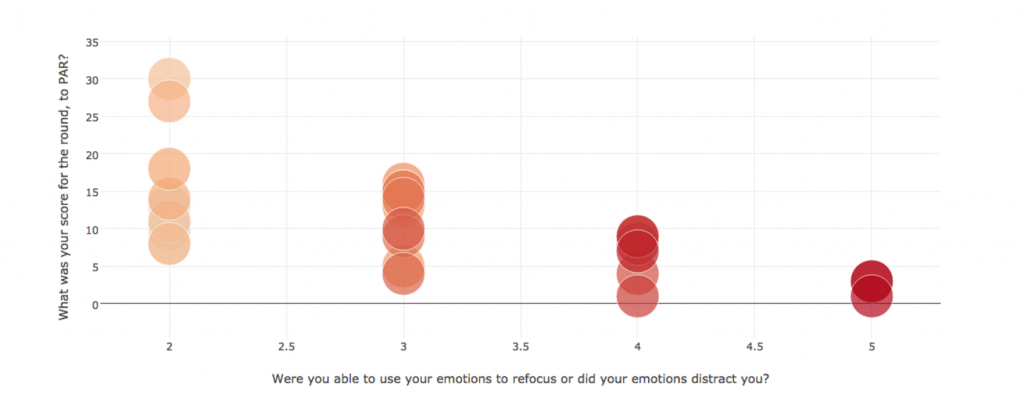
See the chart below which shows what a moderate negative relationship looks like for the variables “were you able to use your emotions to refocus or did your emotions distract you?”. As the player better uses their emotions to refocus, their score goes down.
The grouped data from this analysis is more “centralized” and strong relationships are not as likely to show themselves. We have looked at the correlation coefficient analysis for individual players and have seen very strong relationships in their process.
Using Biirdie to help you or your students with this type of analysis is truly a novel way to begin learning and understanding which aspects of your game that you can control will most likely influence the outcome of your round.
If you’d like to try it out yourself visit the website biirdiegolf.com and use the coupon code golfsciencelab and get ONE MONTH FREE.